Since a long time, Visual Basic and Visual Studio have Crystal report with it. People are saying that since 1993. But in VS2010, they excluded Crystal reports. Yes, what you just heard is right, Crystal Report has been dropped from Visual Studio 2010. But don't worry, it is available as a separate download from the SAP web site. These are the things that I found from the internet.
'It turns out that Crystal Reports for Visual Studio 2010 will be released separately, instead of included with the product and Most importantly, Crystal Reports for Visual Studio 2010 will continue to be free, with no registration required.'
Download Crystal report from this link, or just directly paste the link below to your address bar and it will ask to save an EXE file.
Introduction
I was searching the internet for Crystal reports in 2010 and I found in 2005, but was not able to find any particular tutorials for 2010. So I thought, let me take a chance to write it for some beginners like me who have not worked on Crystal Reports earlier.
In this article, I will show you simple report creation process with screenshots. A picture is worth more than a thousand words, so I always believe in an article with screenshots.
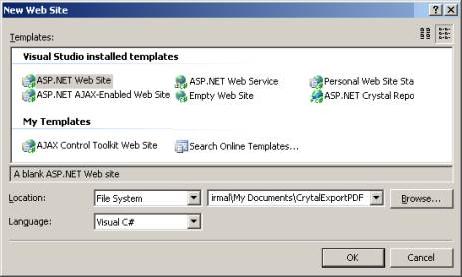
Let's start by creating a new website in VS2010. See the following screen:
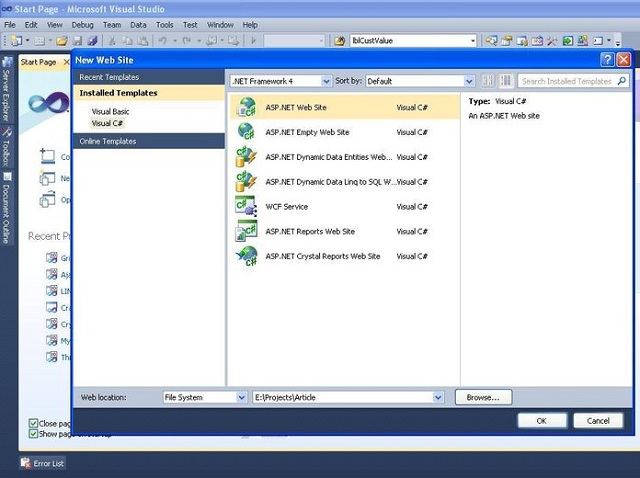
Figure 1
As per figure 1, create a new website in VS2010 and name it as per your choice. Now let me show you the database table structure.
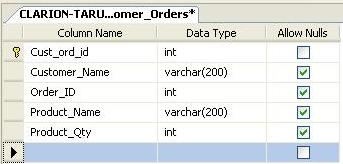
Figure 2
The above figure shows the db table structure. And the below figure (Figure 3) will show you some sample data in the table:
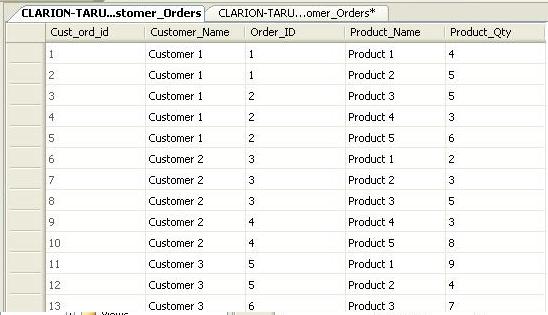
Figure 3
If you want to run this sample project directly, then you can download the database script from the link at the top.
Now we have to create an xsd file as a blank data source as we are going to use strong data type. Here I will divide this tutorial in 5 sub sections as mentioned below:
- Simple report using Crystal Reporting Tool
- Group report
- Chart report
- Sub report
- Cross tab report
Simple Report using Crystal Report
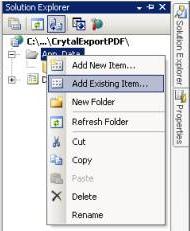
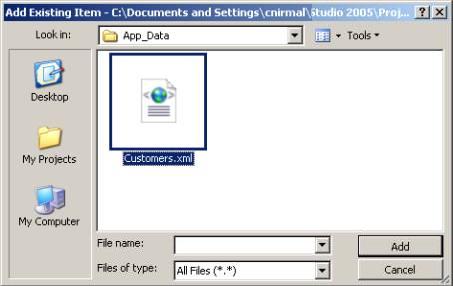
The below figure shows you the process to create an XSD file.
For adding an XSD file, click on Solution Explorer -> Right Click on Project -> click on Add new Item and then it will show you the below screen.
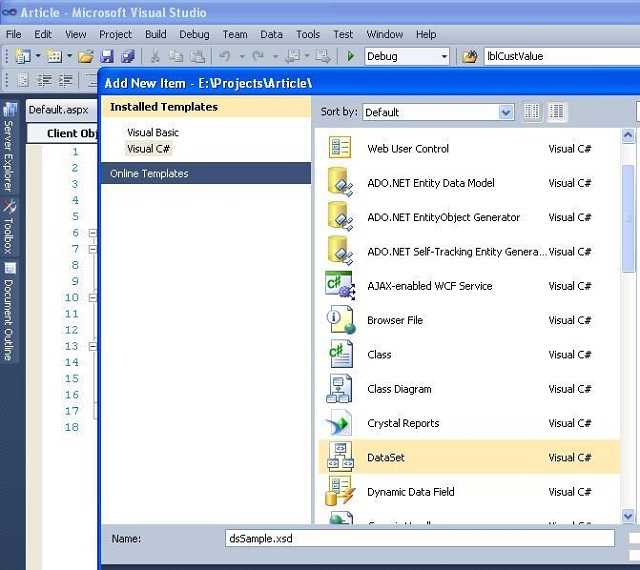
Figure 4
Click on the ok button, so it will ask for confirmation to put that file in App_Code folder. Just click ok and that file will open in the screen as a blank screen.
Now we will add one blank datatable to that XSDfile. Just right click on the file and select Add -> Datatable. It will add one
DataTable1 to the screen. Figure 5 shows how to add datatable to XSD file.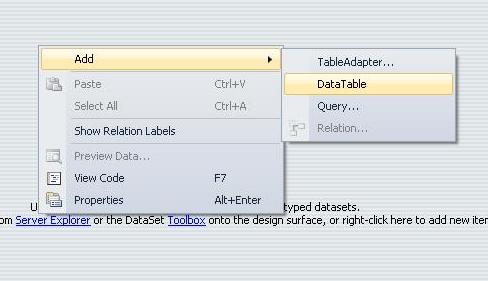
Figure 5
Now
datatable1 is added to XSD file. Now we will add data column to the datatable1 as per figure 6. Remember whatever fields (columns) we add here, it will be available to show on the report. So add column which you want to display in your reports one by one here.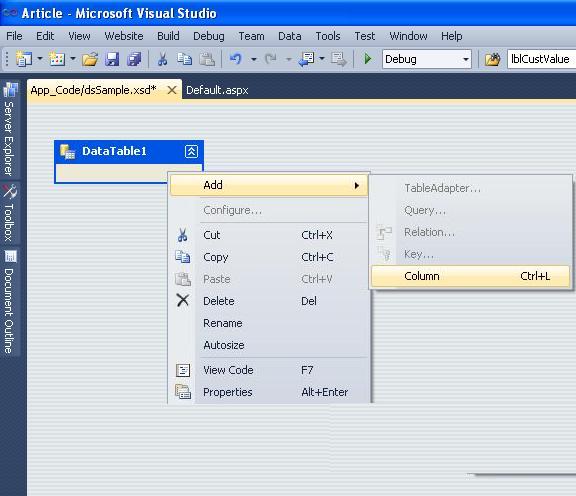
Figure 6
Remember to give the exact same name for data column as in database and also select data type which is the same as database, otherwise you will get an error for field and data type mismatch.
Once we add all the required columns in datatable, then set property for the
datacolumn as it has in database. The below figure will show you how to set property for data columns. Default datatype for all the columns is string here so if datatype is other than string then only change it manually.Just right click on the
datacolumn in datatable and select property and from property window, select appropriate datatype from DataType Dropdown for that datacolumn.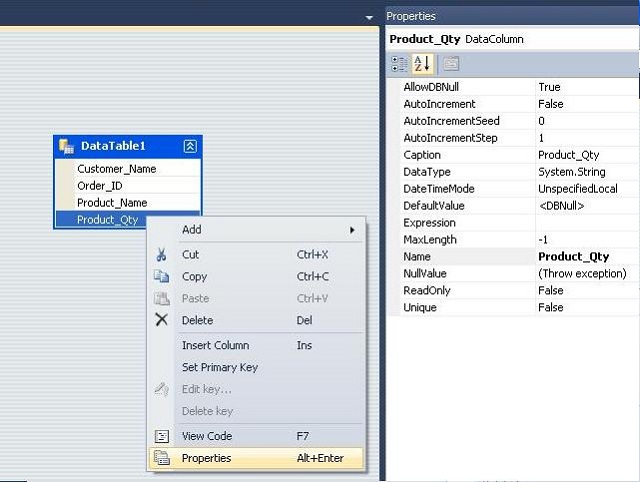
Figure 7
That's it. XSD file creation has been done. Now we will move to create Crystal report design.
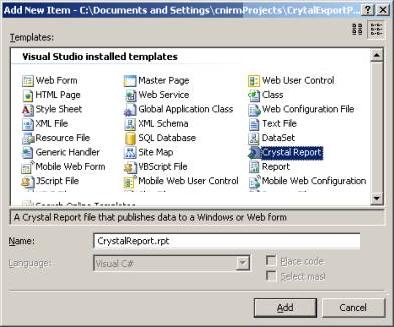
Just click on the Solution Explorer -> Right click on the project name and select crystal reports. Name it as per your choice and hit the add button.
Figure 8 will show you the creation process of Crystal reports.
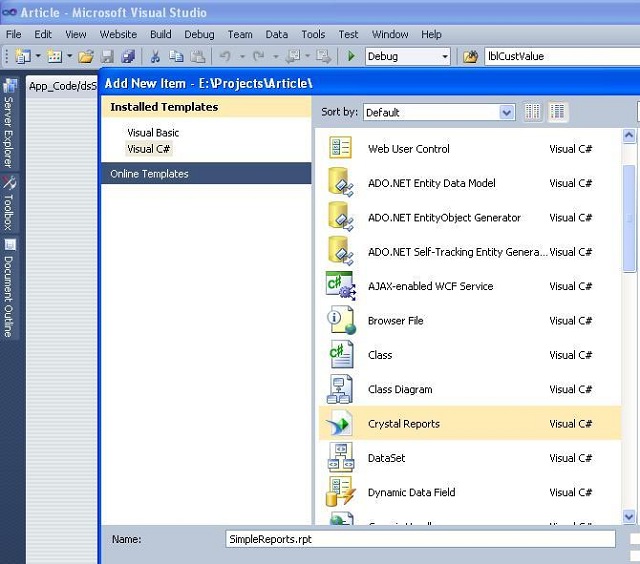
Figure 8
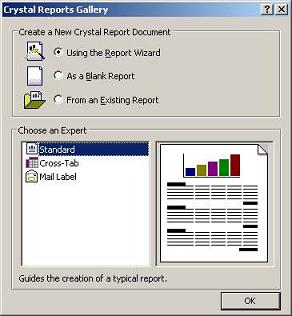
Click on the add button and one .rpt file will be added to the solution. And also, it will ask for the report creation type of how you want to create the report. Figure 9 will show you a screenshot.
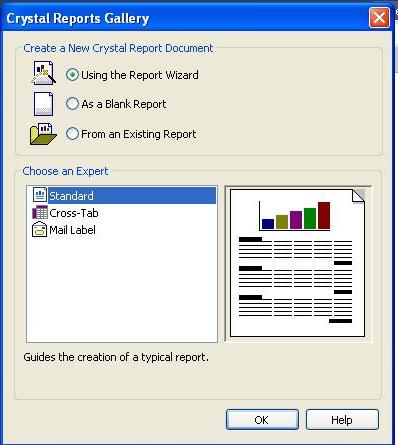
Figure 9
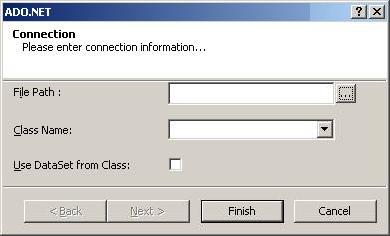
Just click ok button to proceed. It will lead you to figure 10:
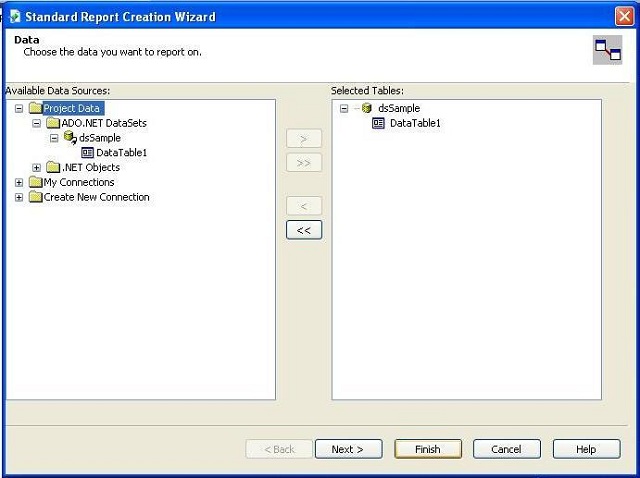
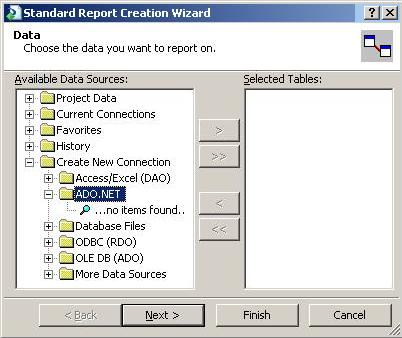
Figure 10
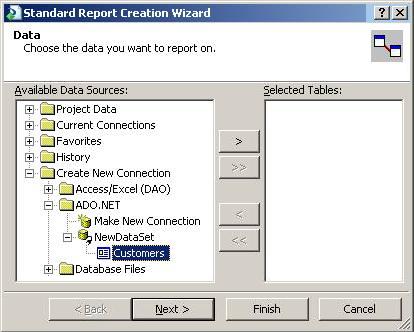
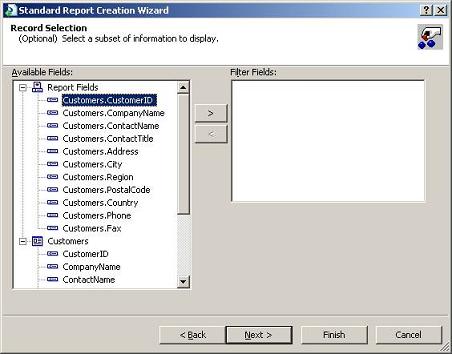
Under project data, expand ADO.NET Datasets and select
DataTable1 and add to the selected table portion located at the right side of the windows using > button.Now click on the Finish button and it will show the next screen (Figure 11):
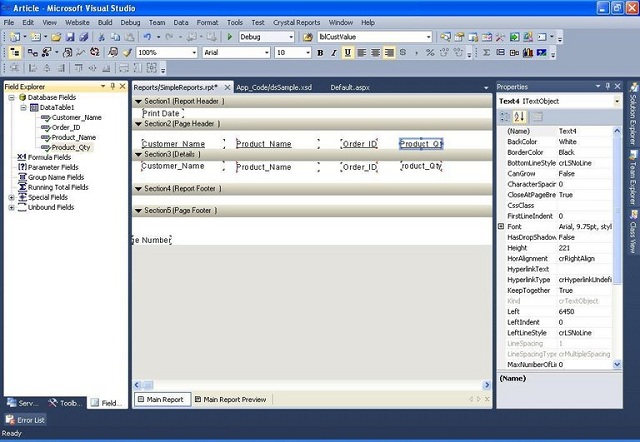
Figure 11
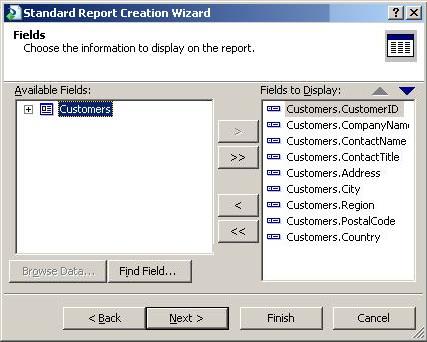
Once report file is added, you can see Field Explorer on the left side near server explorer.
Expand Database Fields, under that you will be able to find Datatable that we have created earlier. Just expand it and drag one by one filed from Field Explorer to the rpt file under detail section.
Now the report design part is over. Now we have to fetch the data from database and bind it to dataset and then bind that dataset to the report viewer.
Let's go step by step.
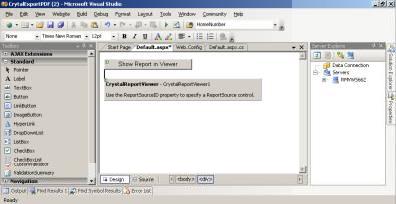
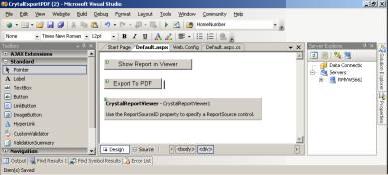
First Drag a
CrystalReportViewer control on aspx page from tool box as per below screen: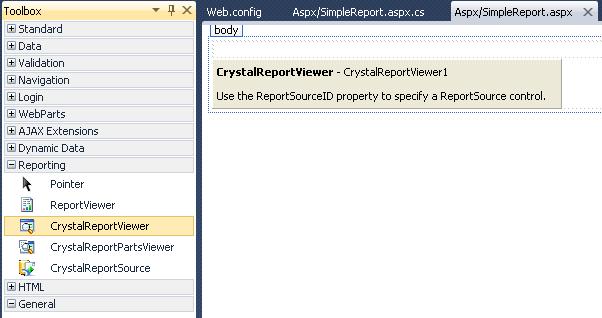
Figure 12
Now we will fetch the data, pass data to the dataset and then add that dataset to the Crystal Report. Below is the C# code which will do the job:
using CrystalDecisions.CrystalReports.Engine;
using CrystalDecisions.Shared;
using System.Data;
using System.Data.SqlClient;
using System.Configuration;
Below is the final code for reports:
protected void Page_Load(object sender, EventArgs e)
{
ReportDocument rptDoc = new ReportDocument();
dsSample ds = new dsSample(); // .xsd file name
DataTable dt = new DataTable();
// Just set the name of data table
dt.TableName = "Crystal Report Example";
dt = getAllOrders(); //This function is located below this function
ds.Tables[0].Merge(dt);
// Your .rpt file path will be below
rptDoc.Load(Server.MapPath("../Reports/SimpleReports.rpt"));
//set dataset to the report viewer.
rptDoc.SetDataSource(ds);
CrystalReportViewer1.ReportSource = rptDoc;
}
public DataTable getAllOrders()
{
//Connection string replace 'databaseservername' with your db server name
string sqlCon = "User ID=sa;PWD=sa; server=databaseservername;
INITIAL CATALOG=SampleDB;PERSISTSECURITY INFO=FALSE;Connect Timeout=0";
SqlConnection Con = new SqlConnection(sqlCon);
SqlCommand cmd = new SqlCommand();
DataSet ds = null;
SqlDataAdapter adapter;
try
{
Con.Open();
//Stored procedure calling. It is already in sample db.
cmd.CommandText = "getAllOrders";
cmd.CommandType = CommandType.StoredProcedure;
cmd.Connection = Con;
ds = new DataSet();
adapter = new SqlDataAdapter(cmd);
adapter.Fill(ds, "Users");
}
catch (Exception ex)
{
throw new Exception(ex.Message);
}
finally
{
cmd.Dispose();
if (Con.State != ConnectionState.Closed)
Con.Close();
}
return ds.Tables[0];
}hrow new Exception(ex.Message);
}
finally
{
cmd.Dispose();
if (Con.State != ConnectionState.Closed)
Con.Close();
}
return ds.Tables[0];
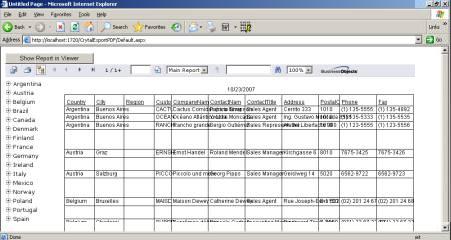
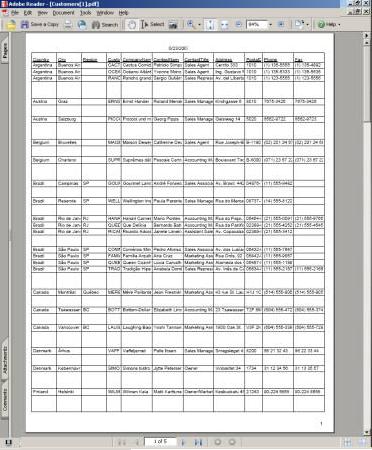
} Now just save everything and run report. It will look like the below figure:
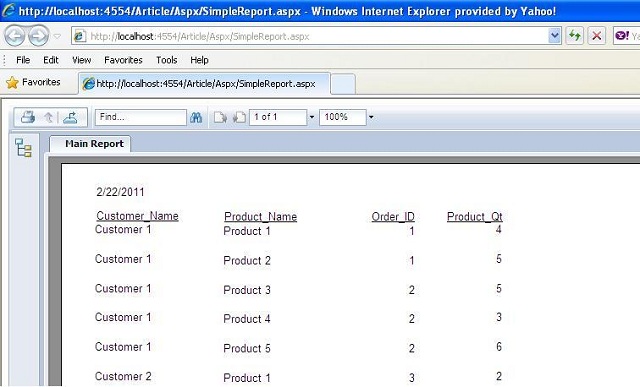
Figure 13
Grouping in Crystal Report
Here we will see only report design and rest of the things, you can refer from Section 1. Here we will group
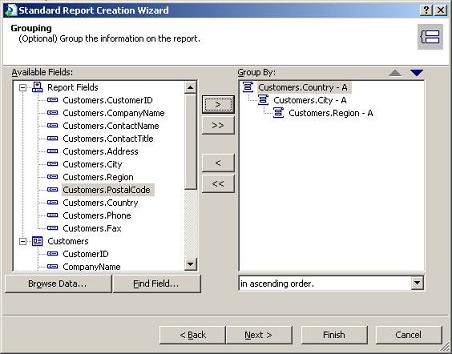
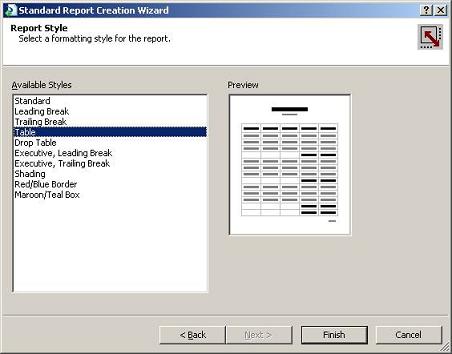
Customer, Product, Order and Quantity. For details, just go through Figure 14.Just add a report (.rpt) file to the solution. Select the appropriate
dataset from popup window. Once it's done, then select grouping option like figure 14.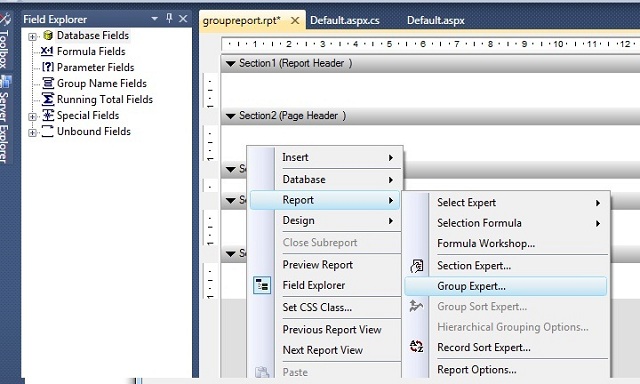
Figure 14
Now, right click on the report, select Report -> Group Experts and the resulting window will look like figure 15:
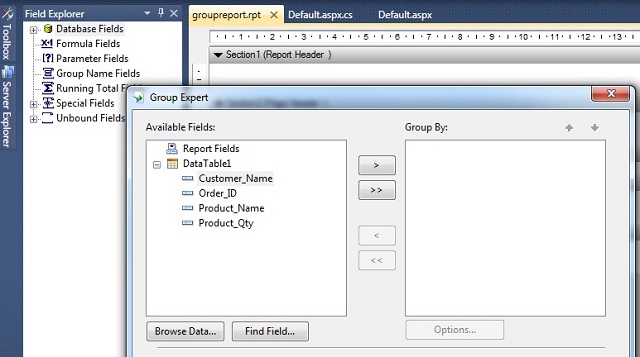
Figure 15
Now we want to group like Customer Name and Product name so first add
Customer to the right Panel. Then move product name to the right panel like figure 16: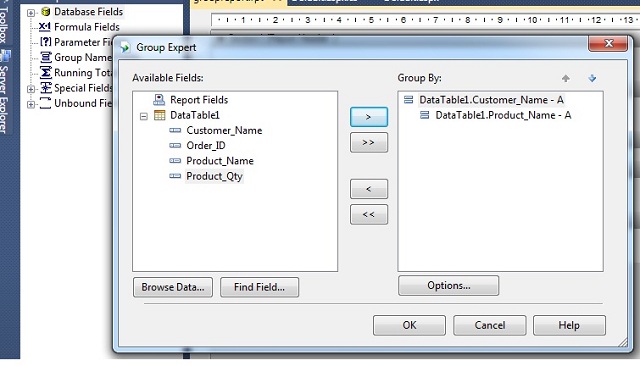
Figure 16
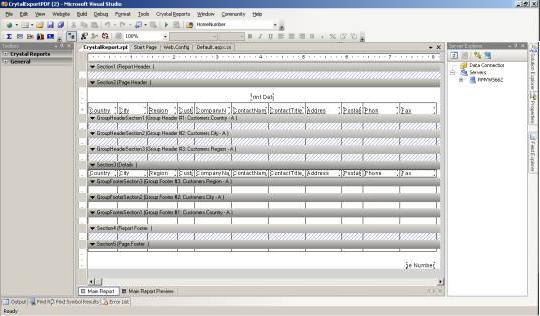
This time Crystal report design will be different than the previous time. See figure 17.
GroupHeaderSection1 and GroupHeaderSection2 are added to the report designer. Here Group #1 Name refers to Customer Name and Group #2 Name refers to Product Name.And also
GroupFooterSection1 and GroupFooterSection2 are added below if you want to add something to group footer.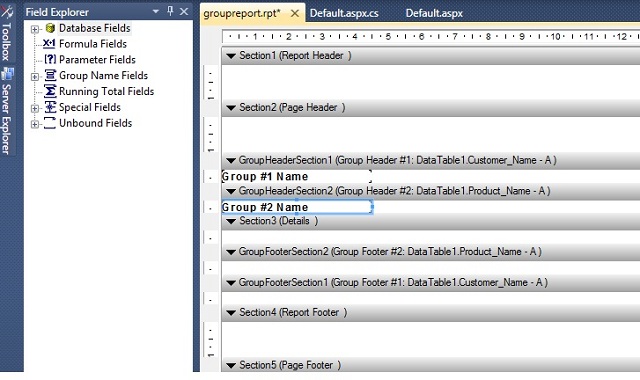
Figure 17
Now under every group, we want to show the number of orders per customer and productwise, so for that, we have to add summary to the
GroupFooterSection2. Refer to Figure 18.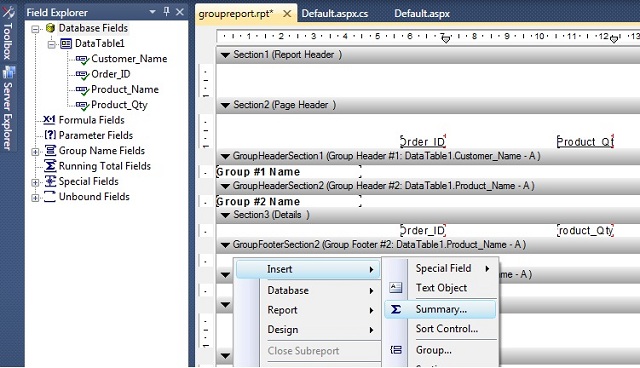
Figure 18
Right Click on the
GroupFooterSection select Insert -> Summary. It will show you the next screen (Figure 19). And I have also added Order_ID and Product_Qty field to the detail (section 3) part.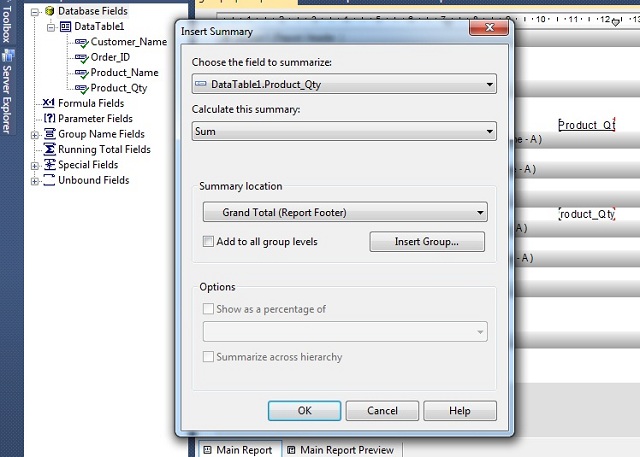
Figure 19
In summary window, select the column which you want to summarize in the first dropdown.
Select Sum (First option) from the calculate drop down.
Summary Location is already set to the report footer. So just click ok to place that summary field to the report.
By default, Summary field is added to the Report Footer section so move it to the
groupFooterSection2 if you want to group product wise, move it to the GroupFooterSection1 if you want to group Customer wise or keep it at original place if you want to sum all ordered products. I have moved to the FooterSection1 so it will show Customer Wise Total Quantity. Refer to Figure 20.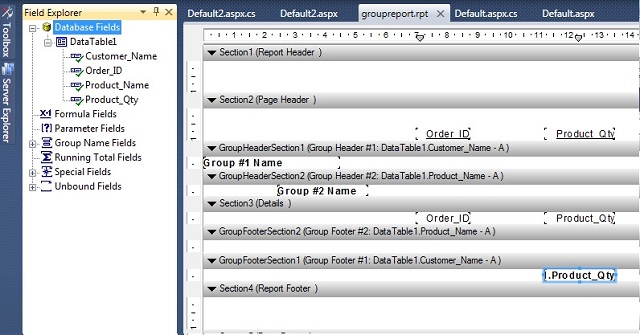
Figure 20
Now save the report and run it finally. It looks like figure 21.
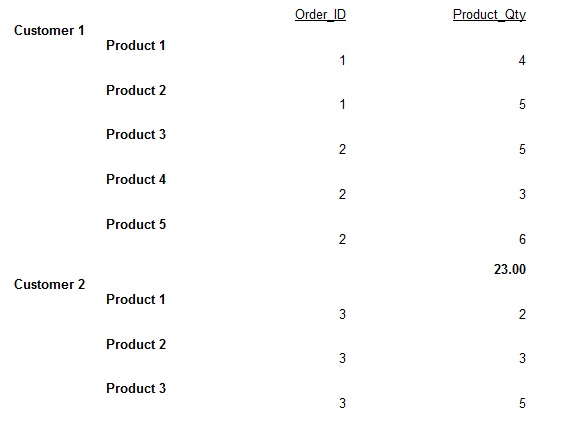
Figure 21
Chart in Crystal Report
Chart is the most important and visible part of the reporting tool. Crystal has very powerful feature to add chart in report. Let's see how to add chart in CR. Here also, we will see only designing of the chart for other thing. Please refer to Section 1.
Here we will show customer wise product ordered quantity in chart. X portion will display
Customer name and Y portion will display customers total ordered quantity.First add charts to the report design.
Right click on the .rpt file and select Insert->Chart. Refer to figure 22.
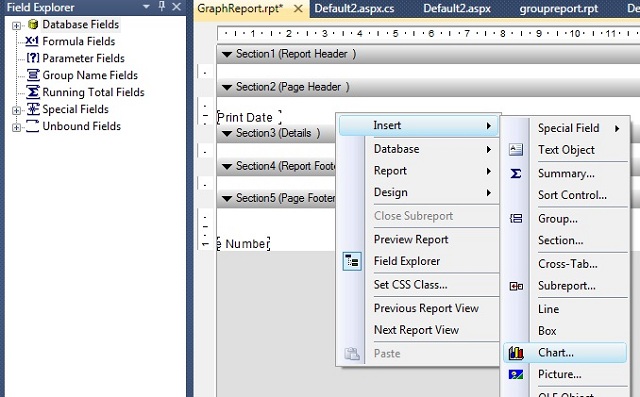
Figure 22
Once you add chart to the report, it will not show chart on the report file but with mouse pointer you can see one blank rectangle is moving. So just click on the Report header. It will open popup for chart style and other options. Refer to figure 23.
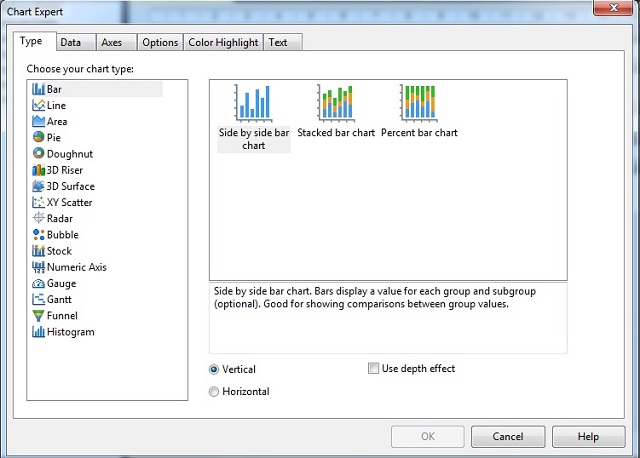
Figure 23
Now from type tab, select type of the charts like bar chart, line chart, pie chart, etc. form the left side. Select sub type from the right pane like side by side chart, percentage bar chart, etc. I am not going into the detail of it. I am leaving it for you to practice work.
And also select vertical or horizontal radio button from the below section if you want to change the chart style vertically or horizontally. Check Use depth effect check box if you need shadow effect on the graph. Refer to figure 23.
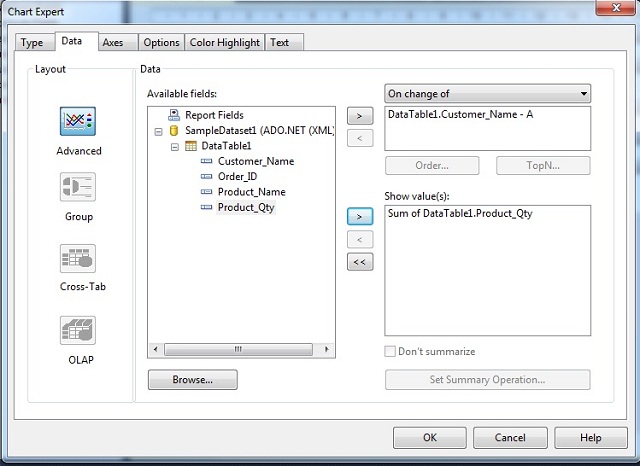
Figure 24
As per figure 24, move to the next tab data. There are three boxes, available fields, on change of and show values. So move Customer Name from available fields to on changes of box, and move Product Quantity filed to the show value box and click ok.
Now you can see chart is added to the report header section as per figure 25.
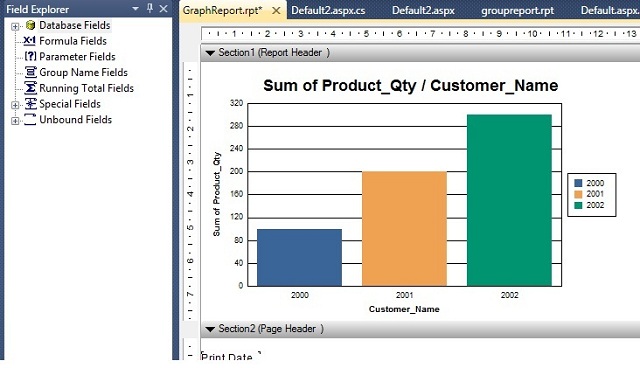
Figure 25
Now, just save the report and run it. You can see a Report as a chart on the screen.
Report Inside Report (Sub Report)
Crystal reports provide reports inside report feature which are normally known as a subreport feature.
Let me explain it in detail. Here also, we will design only sub report design. For rest of the things, refer to Section 1.
Add new report to the solution. Then add Report->Group and select only
Customer name because we want to design report for each customer and sub report product wise. So there will be only one group header inside theCustomergroup header as per figure 26.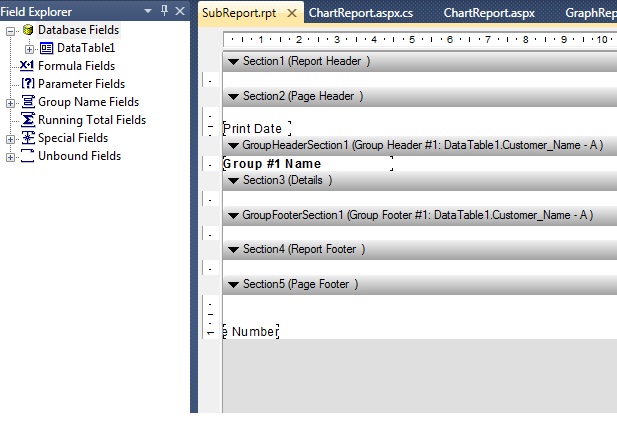
Figure 26
Now right click on Detail section and select Insert->Subreport. Refer to figure 27.
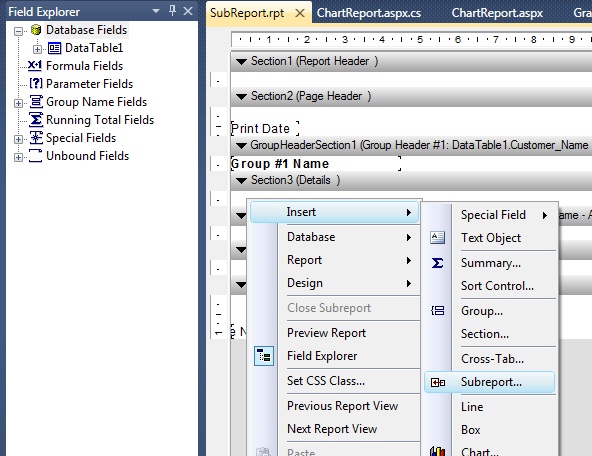
Figure 27
Once we add subreport, it will show screen like figure 28.
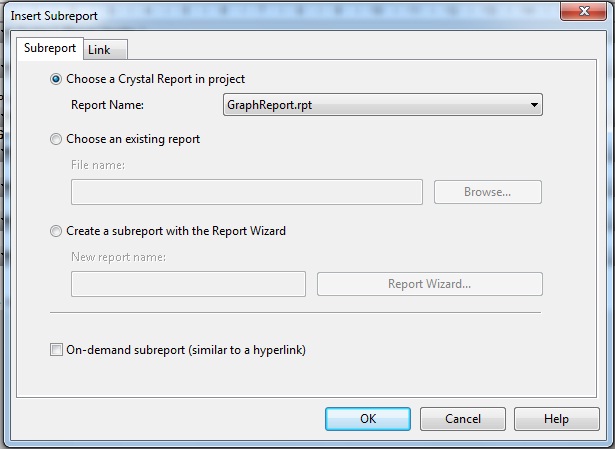
Figure 28
As per figure 28, by default, choose a Crystal Report in project is selected if you want to add report from the project, then otherwise select create a subreport with the report wizard. Once we select create a subreport with Report Wizard (3rd radio button), we have to click on the Report Wizard button to select report type and data source just do as Part - 1 first. Then click on ok button so like chart report it will show a moving rectangle around mouse, click on the detail section where you want to show subreport.
Now to edit the sub report, refer to figure 29.
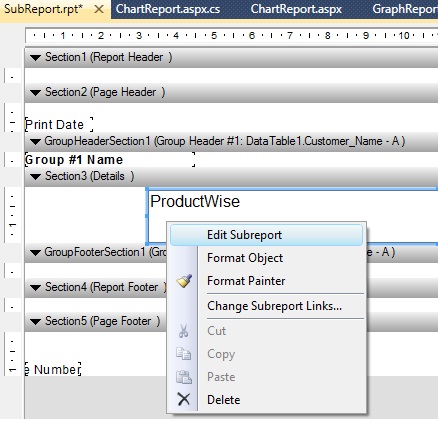
Figure 29
Click on the edit subreport option and format the report as per your need. Here I will suggest add product name and product quantity or you can add chart also for sub report. When you click on the subreport button, it will open subreport designer, actually CR will create a separate .rpt file but it will remain hidden inside the main .rpt file so we can't see it..
Now run the report and you can see the result, report inside report like figure 30.
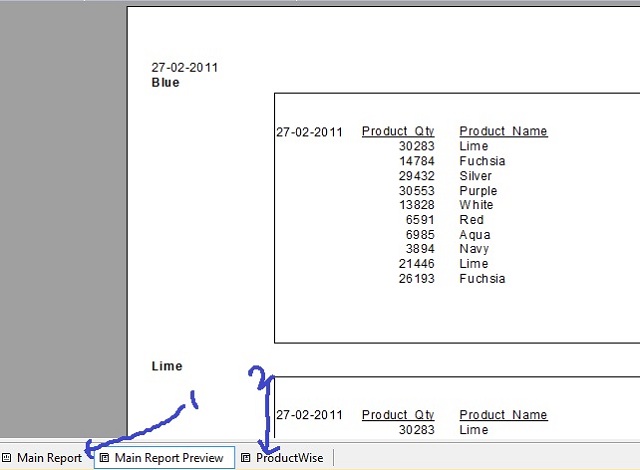
Figure 30
Here number 1 is the main report and number 2 is the subreport it's showing title as Product wise.
Cross Tab Report in Crystal Report
First, let me make it clear as to what is a Cross tab report. Normally, we generate report row wise like first we show customer name, then product wise, etc. But suppose we want to see report as column wise like product name should be displayed as column in report, then cross tab report comes into the picture. See result of Cross Tab report in figure 31.
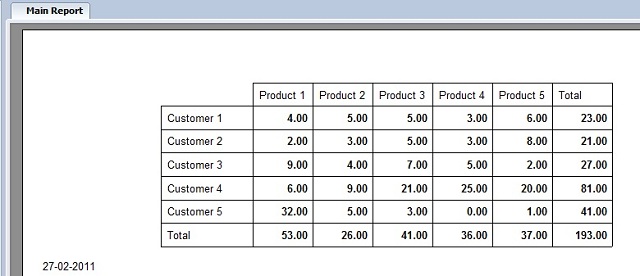
Figure 31
Here also, I will show how to design cross tab report only, for rest of the things, refer to Section 1.
First add .rpt file to the solution. Then add cross report to the Report Header section as per the below figure (Refer to figure 32).
Remember we can add cross tab report only in Report header or report footer section.
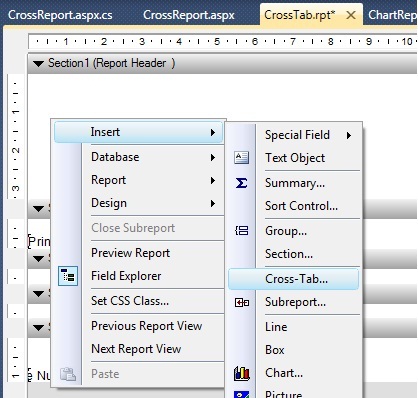
Figure 32
Once we click on cross tab report options, it will show moving rectangle around mouse pointer just place it to the report header section.
As we click on header section, it will lead to the figure 33.
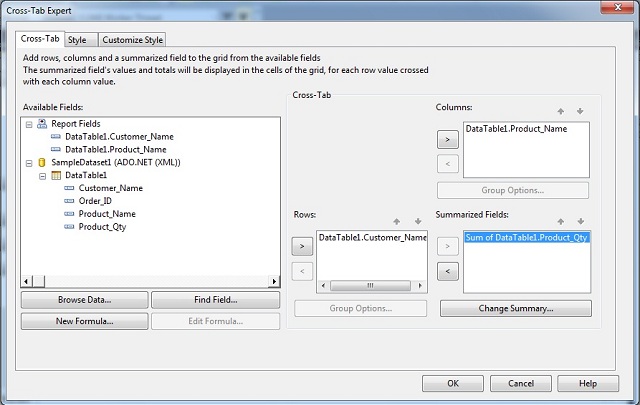
Figure 33
As per the figure, move
Customer name field to the Rows section, Product name we want to show as a Column so move it to the Columns fields, and we want to show product total so move it to the summarized fields. That's it. Just run the report and you can see the output as shown in figure 31.It's as simple as that. If you have any queries regarding any type of the above mentioned reports, please let me know by way of comments. I will try my level best to fulfill your request.
Let's enjoy reporting!
Article Source: DotNet Stuff